

PROJECT A
Project A is the most promising for the Company and investors. It includes fields, which are among the ten biggest recent discoveries in the region. Net land area of the fields covers about 1,160 km2.
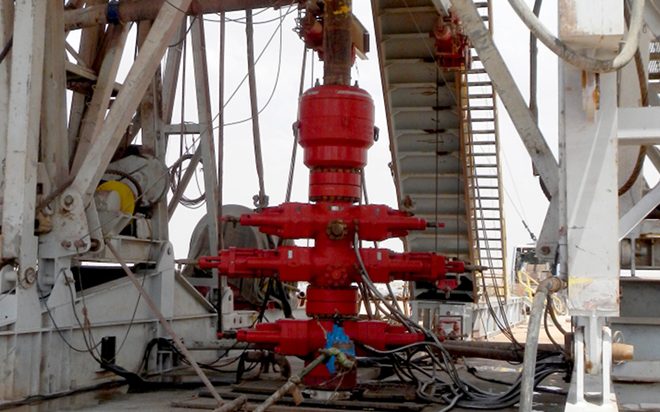
Fields are conventional sandstone reservoir with a depth of 2500 – 3000 meters below the surface and contain light oil, natural gas and gas condensate.
Reserves of hydrocarbons are in process of assessment by the world leading reserve auditor. In accordance with the estimates of the world leading industrial experts:
| RESERVES | BOE, mln. |
| 2P (proved and probable) | 129 |
| 1P (proved) | 56 |
Last reserve audit clearly stated significant upside of reserves 2P (proved and possible) up to 260 mln. BOE.
By the present moment more than 19 wells have been already drilled and commercially flow tested, which allows with high degree of probability to predict low risk of fields exploration and achievement of the targeted results of production. Similarity and continuity of oil bearing formations, and also high gas saturation underpin high profitability of the project. Analysis of available wells drilling and testing results gives 30% probability of reserves increase in that area.
Table. Summary of Project A
| items | Units | 2018 | 2019 | 2020 | 2021 | 2022 | 2023 – 2038 | TOTAL | |||||||||
| Oil production | tcm | – | 198 | 847 | 884 | 900 | 6 242 | 9 072 | |||||||||
| Gas production | mcm | – | 115 | 602 | 929 | 925 | 4 227 | 6 797 | |||||||||
| LPG production | mcm | – | 1 | 26 | 82 | 136 | 1 516 | 1 761 | |||||||||
| Production wells, average for the period | wells | – | 12 | 34 | 42 | 42 | 42 | 42 | |||||||||
| Revenues from crude oil and natural gas sales | thCHF | – | 22 100 | 117 000 | 179 500 | 207 700 | 1 682 700 | 2 209 000 | |||||||||
| CAPEX | thCHF | 54 300 | 39 800 | 41 400 | 19 600 | – | 14 600 | 169 700 | |||||||||
| OPEX | thCHF | 2 800 | 7 100 | 33 700 | 45 800 | 50 100 | 567 900 | 707 300 | |||||||||
| Depreciation | thCHF | 2 700 | 4 700 | 6 800 | 7 800 | 7 800 | 8 500 | 38 200 | |||||||||
| EBITDA | thCHF | – 2 800 | 15 000 | 83 300 | 133 700 | 157 700 | 1 114 800 | 1 501 700 | |||||||||
| EBITDA margin | % | 68% | 71% | 74% | 76% | 66% | 68% | ||||||||||
| Net profit | thCHF | – 4 400 | 8 200 | 61 200 | 100 800 | 119 900 | 885 100 | 1 170 800 | |||||||||
| Performance indicators | |||||||||||||||||
| NPV | thCHF | 528 300 | |||||||||||||||
| IRR | % | 82% | |||||||||||||||
| ROI | % | 982% | |||||||||||||||
Please be informed that nowadays the Company also applies for an additional exploration permit covering the area of 1,053 km2 to the west of the A field.
PROJECT B (OPTIONAL)
The founders of the Company keep holdings in the fields in CIS with oil and gas reserves 2 P (proved and probable) of 40 mln. BOE according to the report of DeGolyer and MacNaughton.
| Natural Gas (106m3) | BOE, mln | |
| 2P (proved and probable) | 6 300 | 40 |
| 1P (proved) | 4 193 | 26 |
- Exploration stage finalized.
- 6 wells had already been drilled and well tested, with flow debit of 260-500 thousand m 3 per day. Pipelines run through the fields.
The Company needs to construct about 6 km of gas-collecting network to connect to main pipeline. Besides this, CAPEX program includes drilling of horizontal wells to increase daily gas flow rate. The total remaining CAPEX is CHF 9 mln. Up to date more than CHF 19,4 mln have been invested in exploration and appraisal drilling and pilot testing.
Table. Production and financial indicators of Project B
| Items | Units | 2018 | 2019 | 2020 | 2021 | 2022 | 2023 – 2043 | TOTAL | |||||||||
| Production of natural gas | mcm | – | 781 | 781 | 781 | 758 | 3 266 | 6 366 | |||||||||
| Production wells, average for the period | wells | 3 | 6 | 6 | 6 | 6 | 4 | ||||||||||
| Revenues from crude oil and natural gas sales | thCHF | – | 52 100 | 52 100 | 52 100 | 50 600 | 218 200 | 425 100 | |||||||||
| Costs | thCHF | ||||||||||||||||
| CAPEX | thCHF | 8 400 | 200 | 200 | 200 | 200 | 2 500 | 11 700 | |||||||||
| OPEX | thCHF | 400 | 21 000 | 21 000 | 28 800 | 20 400 | 103 900 | 195 500 | |||||||||
| Depreciation | thCHF | 400 | 900 | 900 | 900 | 900 | 5 000 | 9 000 | |||||||||
| EBITDA | thCHF | – 400 | 38 600 | 38 600 | 28 900 | 37 500 | 149 300 | 292 500 | |||||||||
| EBITDA margin | % | – | 74% | 74% | 56% | 74% | 56% | 69% | |||||||||
| Net profit | thCHF | – 800 | 30 200 | 30 200 | 22 400 | 29 300 | 115 600 | 226 900 | |||||||||
| Performance indicators | |||||||||||||||||
| NPV | thCHF | 112 300 | |||||||||||||||
| IRR | % | 351% | |||||||||||||||
| ROI | % | 1255% | |||||||||||||||
Table. Summary of A and B projects
| Items | 2018 | 2019 | 2020 | 2021 | 2022-2046 | |
| Oil production | 000 tons | – | 1 293 | 7 417 | 15 952 | 229 884 |
| Gas production | mcm | – | 896 | 1 382 | 1 709 | 7 493 |
| LPG production | mcm | – | 1 | 26 | 82 | 1 516 |
| Revenue | thCHF | – | 103 100 | 348 600 | 628 000 | 5 847 800 |
| OPEX | thCHF | 9 100 | 51 100 | 95 100 | 142 500 | 2 300 100 |
| EBITDA | thCHF | – 9 100 | 59 500 | 261 000 | 491 100 | 3 719 900 |
| Transfer to the Pool of Tokens | thCHF | – | 6 760 | 78 420 | 167 520 | 1 340 670 |
| CAPEX, incl. acquisition cost | thCHF | 111 700 | 280 400 | 213 600 | 120 300 | 17 100 |
| IRR | % | 110% | ||||
| NPV | thCHF | 1 613 721 | ||||
| ROI | % | 1 326% |